THANK YOU FOR SUBSCRIBING
Editor's Pick (1 - 4 of 8)

Using Data Dashboards to Support Struggling Students: A Big Data Application in Higher Education
Chris Harris, Executive Dean, Kaplan Singapore


Chris Harris, Executive Dean, Kaplan Singapore
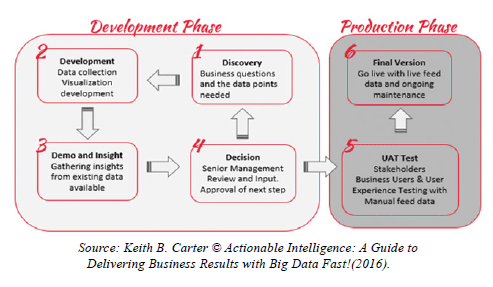
As the project plan below demonstrates, Step 1 was a discovery around getting some consensus on what Business Questions we wanted answered (Carter, 2016). While the framework below seems to illustrate a consistent time frame on each step, were it to scale, Step 1 would be several times bigger than the other steps. Like the metaphor of working out the most efficient and effective way to cut down a tree, Keith taught us to sharpen our axes before we approached the tree.
 Our axes were our business questions; we came up with questions around the 5 W’s and 1 H:
• Who are our students by entry qualification?
• What are their age, nationality, and other demographic profile?
• When do they withdraw (attrite) if they do?
• Where do they live and does this impact results?
• How does their attendance and other variables relate to their performance?
• Why is success/failure early a predictor of success/ failure later?
With this starting list of questions the iterative nature of changes and modifications to the list kept us coming back to priorities and ensured project alignment to broader Institutional Mission and Vision around the student
experience, pedagogy and their learning journey.
3. Details: Three Little Gems From the Big Mine
Of the countless working groups and approaches implicit in the detail of the Framework (Figure 2), three stood out for their contribution to the resulting dashboards and subsequent timely interventions for students:
1. Data Quality Group: the assurance of many different pairs of eyes both looking at data and coming to consensus on definitions of what the data represented was vital for validating the data but also the project. For example, we had previously attributed some of our inaction to uncertainty about the student data, but with consensus that the data was valid, we could not do that anymore;
 2. Data Visualization Proof of Concept for three months: With the data assured, agreeing on the aesthetic of the dashboards was vital in ensuring it could be used by a range of users from high end strategic users to those who would need the 360 degree profile of students with which to contact them promptly via the best channel.
3. Staff Training on the actionable nature of the intelligence: reinforcing the mindset that a duty to act on the data was paramount or as one project member said “The dashboard won’t meet the student, we will”;
4. Early Days, but some results
From big data, little patterns show. Even in User Acceptance Testing (UAT), we started to see illuminated the profiles of students that had a greater tendency to struggle over others. We also saw the significance of accounting and other first semester subjects as a predictor of future performance overall. This only served to vindicate our efforts, but it was time to act on the data!
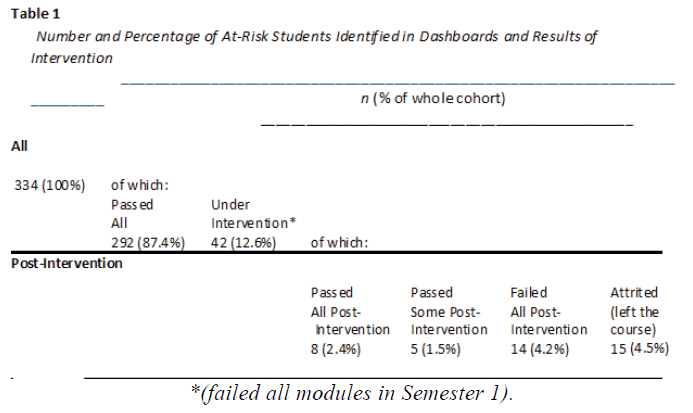
As the results for the Diploma Course pilot below show, the dashboards revealed an at-risk population—defined as students who failed all subjects in a term—of 12.6 percent of the whole cohort that was reduced to 8.7 percent post-intervention. The almost 4 percent improvement of the overall population of the course had a much-improved result after intervention, made up of 2.4 percent passing all subjects (19 percent or 8 of the 42 who received intervention) and a further 1.5 percent passing up to half the subjects (12 percent or 5 students).
 A solid start and more would-be accountants for the world, but ideally we would like to enable all students to succeed, surely the role of any institution, and one in part made easier by actionable intelligence, the right information, in the right hands, at the right time in order to improve outcomes. In these projects we are using it to change lives!
Acknowledgements: Other than Profs. Carter, Johnson and Ann Luo mentioned in the article, the following should be credited withthe success:The Kaplan Singapore Student Journey Project Team consisting of Constance Chee, Alan Lam, Peter Baeck, Nelson Ang, Phani Vemuri, and Sherly Setianingsih and countless others who worked with us.
 Our axes were our business questions; we came up with questions around the 5 W’s and 1 H:
• Who are our students by entry qualification?
• What are their age, nationality, and other demographic profile?
• When do they withdraw (attrite) if they do?
• Where do they live and does this impact results?
• How does their attendance and other variables relate to their performance?
• Why is success/failure early a predictor of success/ failure later?
With this starting list of questions the iterative nature of changes and modifications to the list kept us coming back to priorities and ensured project alignment to broader Institutional Mission and Vision around the student
experience, pedagogy and their learning journey.
3. Details: Three Little Gems From the Big Mine
Of the countless working groups and approaches implicit in the detail of the Framework (Figure 2), three stood out for their contribution to the resulting dashboards and subsequent timely interventions for students:
1. Data Quality Group: the assurance of many different pairs of eyes both looking at data and coming to consensus on definitions of what the data represented was vital for validating the data but also the project. For example, we had previously attributed some of our inaction to uncertainty about the student data, but with consensus that the data was valid, we could not do that anymore;
 2. Data Visualization Proof of Concept for three months: With the data assured, agreeing on the aesthetic of the dashboards was vital in ensuring it could be used by a range of users from high end strategic users to those who would need the 360 degree profile of students with which to contact them promptly via the best channel.
3. Staff Training on the actionable nature of the intelligence: reinforcing the mindset that a duty to act on the data was paramount or as one project member said “The dashboard won’t meet the student, we will”;
4. Early Days, but some results
From big data, little patterns show. Even in User Acceptance Testing (UAT), we started to see illuminated the profiles of students that had a greater tendency to struggle over others. We also saw the significance of accounting and other first semester subjects as a predictor of future performance overall. This only served to vindicate our efforts, but it was time to act on the data!
As the results for the Diploma Course pilot below show, the dashboards revealed an at-risk population—defined as students who failed all subjects in a term—of 12.6 percent of the whole cohort that was reduced to 8.7 percent post-intervention. The almost 4 percent improvement of the overall population of the course had a much-improved result after intervention, made up of 2.4 percent passing all subjects (19 percent or 8 of the 42 who received intervention) and a further 1.5 percent passing up to half the subjects (12 percent or 5 students).
 A solid start and more would-be accountants for the world, but ideally we would like to enable all students to succeed, surely the role of any institution, and one in part made easier by actionable intelligence, the right information, in the right hands, at the right time in order to improve outcomes. In these projects we are using it to change lives!
Acknowledgements: Other than Profs. Carter, Johnson and Ann Luo mentioned in the article, the following should be credited withthe success:The Kaplan Singapore Student Journey Project Team consisting of Constance Chee, Alan Lam, Peter Baeck, Nelson Ang, Phani Vemuri, and Sherly Setianingsih and countless others who worked with us.
A solid start and more would-be accountants for the world, but ideally we would like to enable all students to succeed, surely the role of any institution, and one in part made easier by actionable intelligence, the right information, in the right hands, at the right time in order to improve outcomes. In these projects we are using it to change lives!
Acknowledgements: Other than Profs. Carter, Johnson and Ann Luo mentioned in the article, the following should be credited withthe success:The Kaplan Singapore Student Journey Project Team consisting of Constance Chee, Alan Lam, Peter Baeck, Nelson Ang, Phani Vemuri, and Sherly Setianingsih and countless others who worked with us.Weekly Brief
I agree We use cookies on this website to enhance your user experience. By clicking any link on this page you are giving your consent for us to set cookies. More info
Read Also
Navigating Compliance Challenges in ESG AML and Digital Onboarding
Chuan Lim Ang, Managing Director and SG Head of Compliance, CIMB
A Vision for the Future: Automation, Robotics, and the Smart Factory
Joe Tilli, State Industrial Automation Sales Manager, Lawrence & Hanson
The Rise of Hyper Automation
Erdenezaya Batnasan, Head of IT End-User Support Service Department, Khan Bank
Transforming Business Operations with Robotic Process Automation
Simon So, CMGR, MCMI, Regional Head of Digital Solutions, Richemont Asia Pacifi
Combining Automation with AI to Achieve Human-Like Interaction
Kain Chow, General Manager, Technology & Transformation, New World Development Company Limited
Implementing RPA - 5 Ultimate Prerequisite
Indra Hidayatullah, Data Management & Analytics Division Head, Pt. Bank Tabungan Negara
Incorporating the power of recognition into our vendors' sustainability journey
Cynthia Khoo, Head, Central Procurement Office, OCBC Bank (Malaysia) Berhad
Elevating Guest Experience with Data
Clive Edwards, Senior Vice President, Operations, Capella Hotel Group


